Back to School: How Diverse are NYC’s Classrooms
Digital Briefs
September 6, 2019
The Mayor’s appointed School Diversity Advisory Group recently released its second report, recommending several actions the city could take to help diversify its schools. Regardless of how we get there, the evidence is clear: diverse classrooms create better outcomes, and research shows that ALL students benefit from learning environments that are BOTH racially and economically diverse.
<strong>Back to School Part 2: Do NYC Schools Represent Their Districts?</strong><br> Read our latest analysis looking into whether schools represent the racial/ethnic makeup of their districts.
Read Back to School Part 2 >Our Research & Data Team combed through the data from the 2018-2019 school year to determine the diversity of NYC schools.
Read below to check out some highlights from our findings.
How diverse are NYC’s public schools?
![]()
Student Racial/Ethnic Diversity
One common metric for defining a diverse school is when no one racial/ethnic group exceeds 50% of the student body and no two groups combined exceed 80%.
Just
28%
of all schools were considered racially/ethnically diverse in school year 2018-2019.
To break it down further:
About
1 in 3
of all elementary schools were diverse and only
1 in 4
of all middle schools and high schools.
Diverse learning environments offer many benefits to a child’s education. Yet many of the city’s Black and Latinx students remain in segregated schools.
60%
of all schools are predominantly Black and Latinx – and this grows incrementally higher from Elementary to Middle to High School.
Representation of students in diverse schools
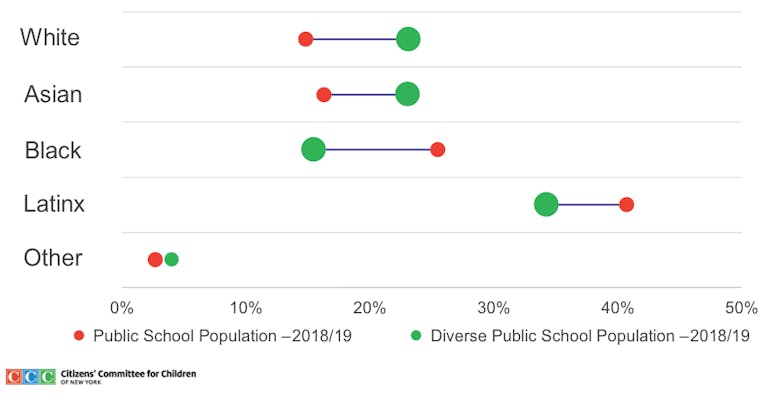
Of the 28% of schools that were considered diverse, there are substantial differences in representation when looking at the racial/ethnic makeup of their enrollment.
White children are only 15 percent of the public school student body but make up 23 percent of students in diverse schools. Asian children — who compose just 16 percent of the public school population — are also over-represented in diverse schools, making up 23 percent of students.
This means that while Black and Latinx students make up over two-thirds of the total student body, their enrollment in diverse school systems is much lower. Instead, Black and Latinx students are more likely to be in predominately Black and Latinx schools, increasing their isolation and contributing to the segregation of the NYC school system as a whole.
66%
Of all Black and Latinx public school students are in predominately Black and Latinx schools
Explore more data on school diversity data by clicking here.
Student Economic Status
Economic status ranges between school districts, where low income students comprise of less than half of the student population in some districts and others serve low-income students almost exclusively.
819,644
students in NYC Public Schools qualify for free/reduced price lunch or HRA benefits.
That represents
72.8%
of the entire public school population.
Explore Student Economic Status indicators here
![]()
Student Economic Need Index
The NYC Department of Education considers eligibility for public assistance, home neighborhood poverty, and student homelessness to calculate a factor called the Economic Need Index (or ENI).
The average ENI for all NYC schools is
69 out of 100
The DOE considers schools with an ENI 10 points above or below this average to be less economically diverse than the average public school. But between school districts ENI can vary even more, signaling the lack of economic diversity even at the district level in the NYC school system.
